May 20, 2026
A simulation is only as useful as the report that comes out of it. Engineering work generates enormous volumes of valuable data, yet without structured reporting, sharing results, documenting decisions, and keeping a clean audit trail quickly turn into a chore. Across every region, Oliasoft customers asked for the same thing: a standardized way to generate structured Excel reports straight from the applications. This is what we delivered.
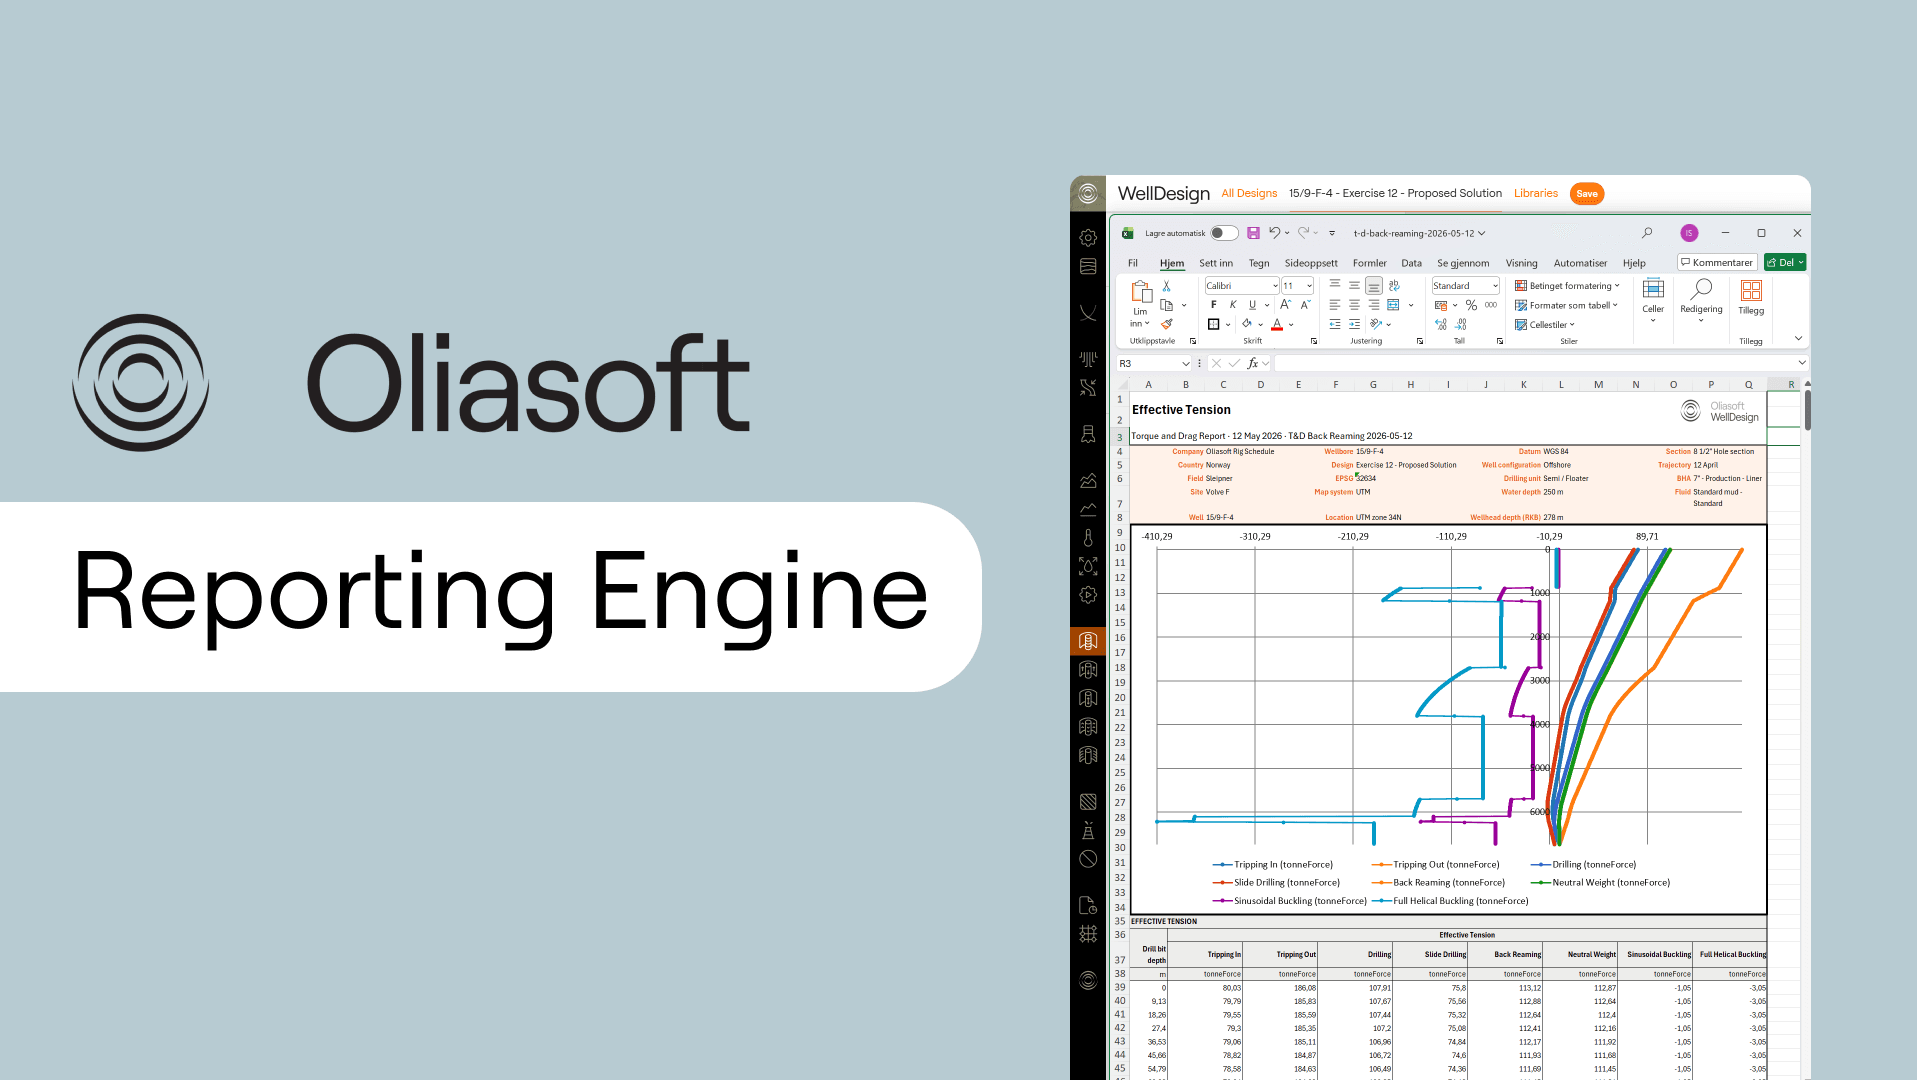
As Oliasoft's products evolved, users leaned on simulation outputs for far more than engineering analysis. They needed them for collaboration, reviews, audits, and operational decisions. To meet that shift, Oliasoft built a standalone reporting engine designed specifically for engineering workflows. It turns simulation data into structured, presentation-ready Excel reports the moment a run completes.
Generating an engineering report takes more than dropping raw numbers into a spreadsheet. Reports have to be readable, traceable, printable, and structured well enough to carry both technical analysis and stakeholder communication.
The reporting engine is a standalone Python-based framework. It transforms structured simulation data into fully formatted Excel workbooks through a reusable, scalable architecture that serves every engineering workflow, with no product-specific export logic in the mix.
At its core sit schema-driven report definitions that organize worksheets, layouts, tables, and chart configurations in a structured, reusable way:
By keeping report structure separate from simulation logic, the framework gives engineering teams a clean path from result to report.
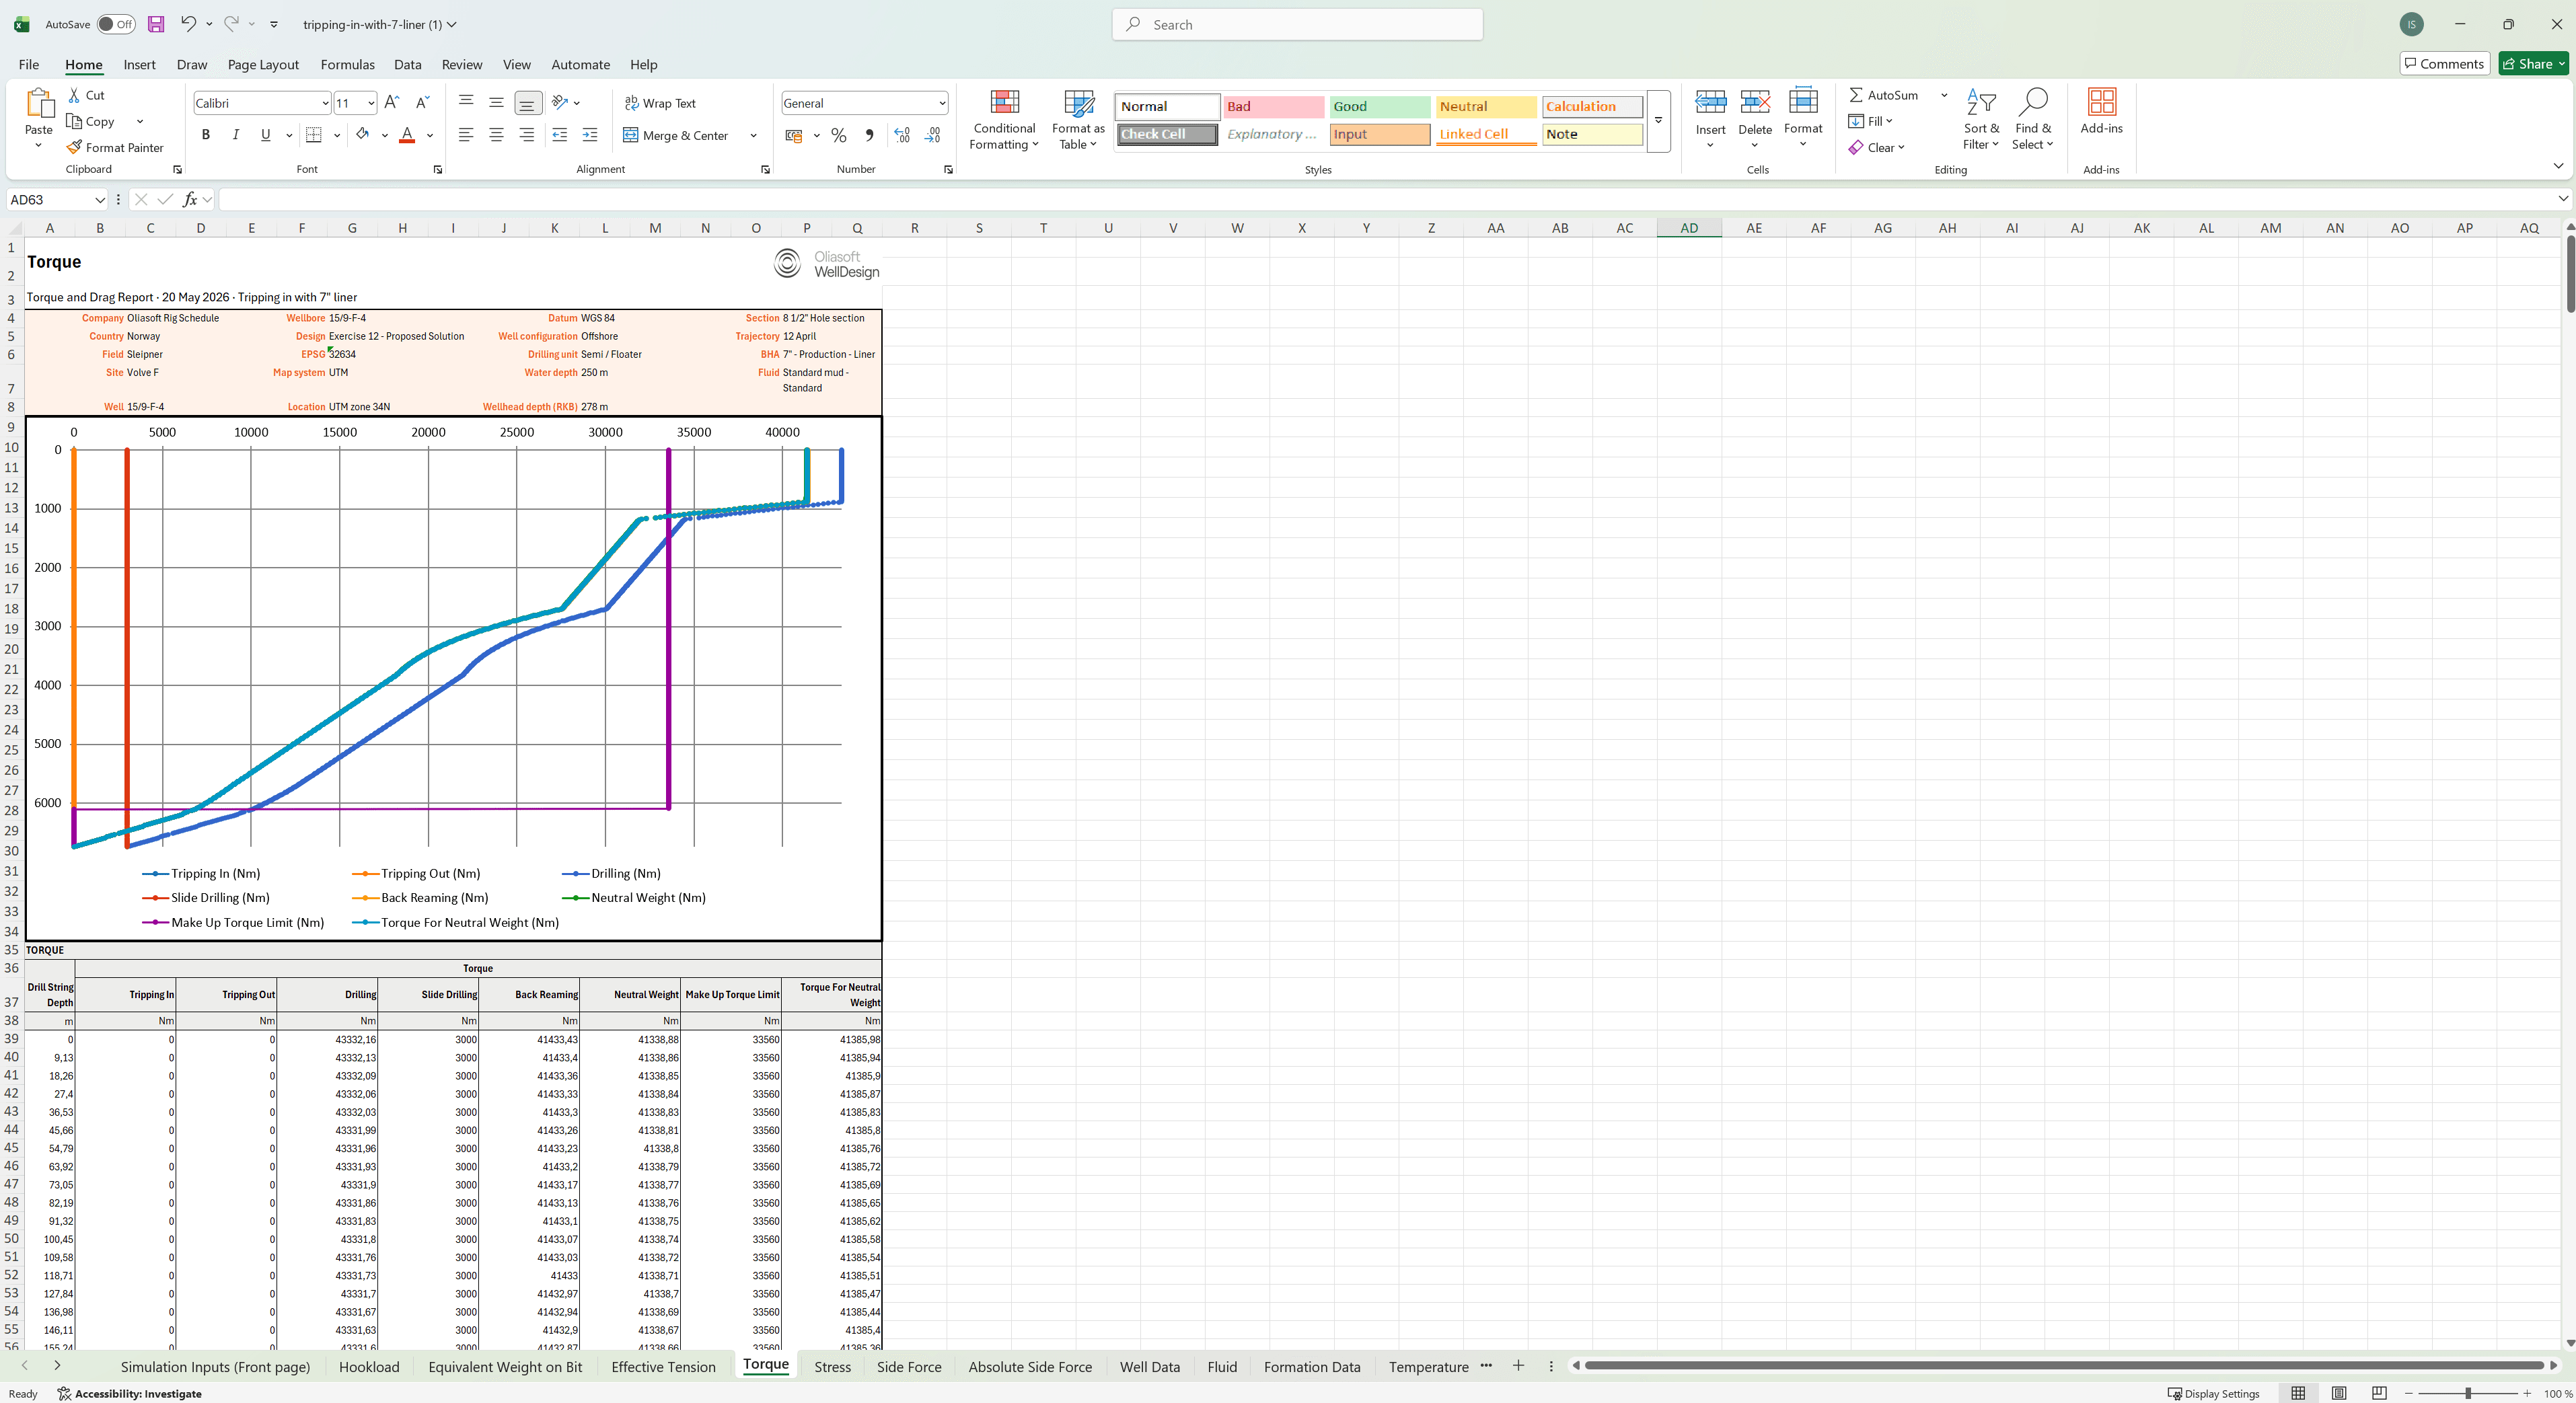
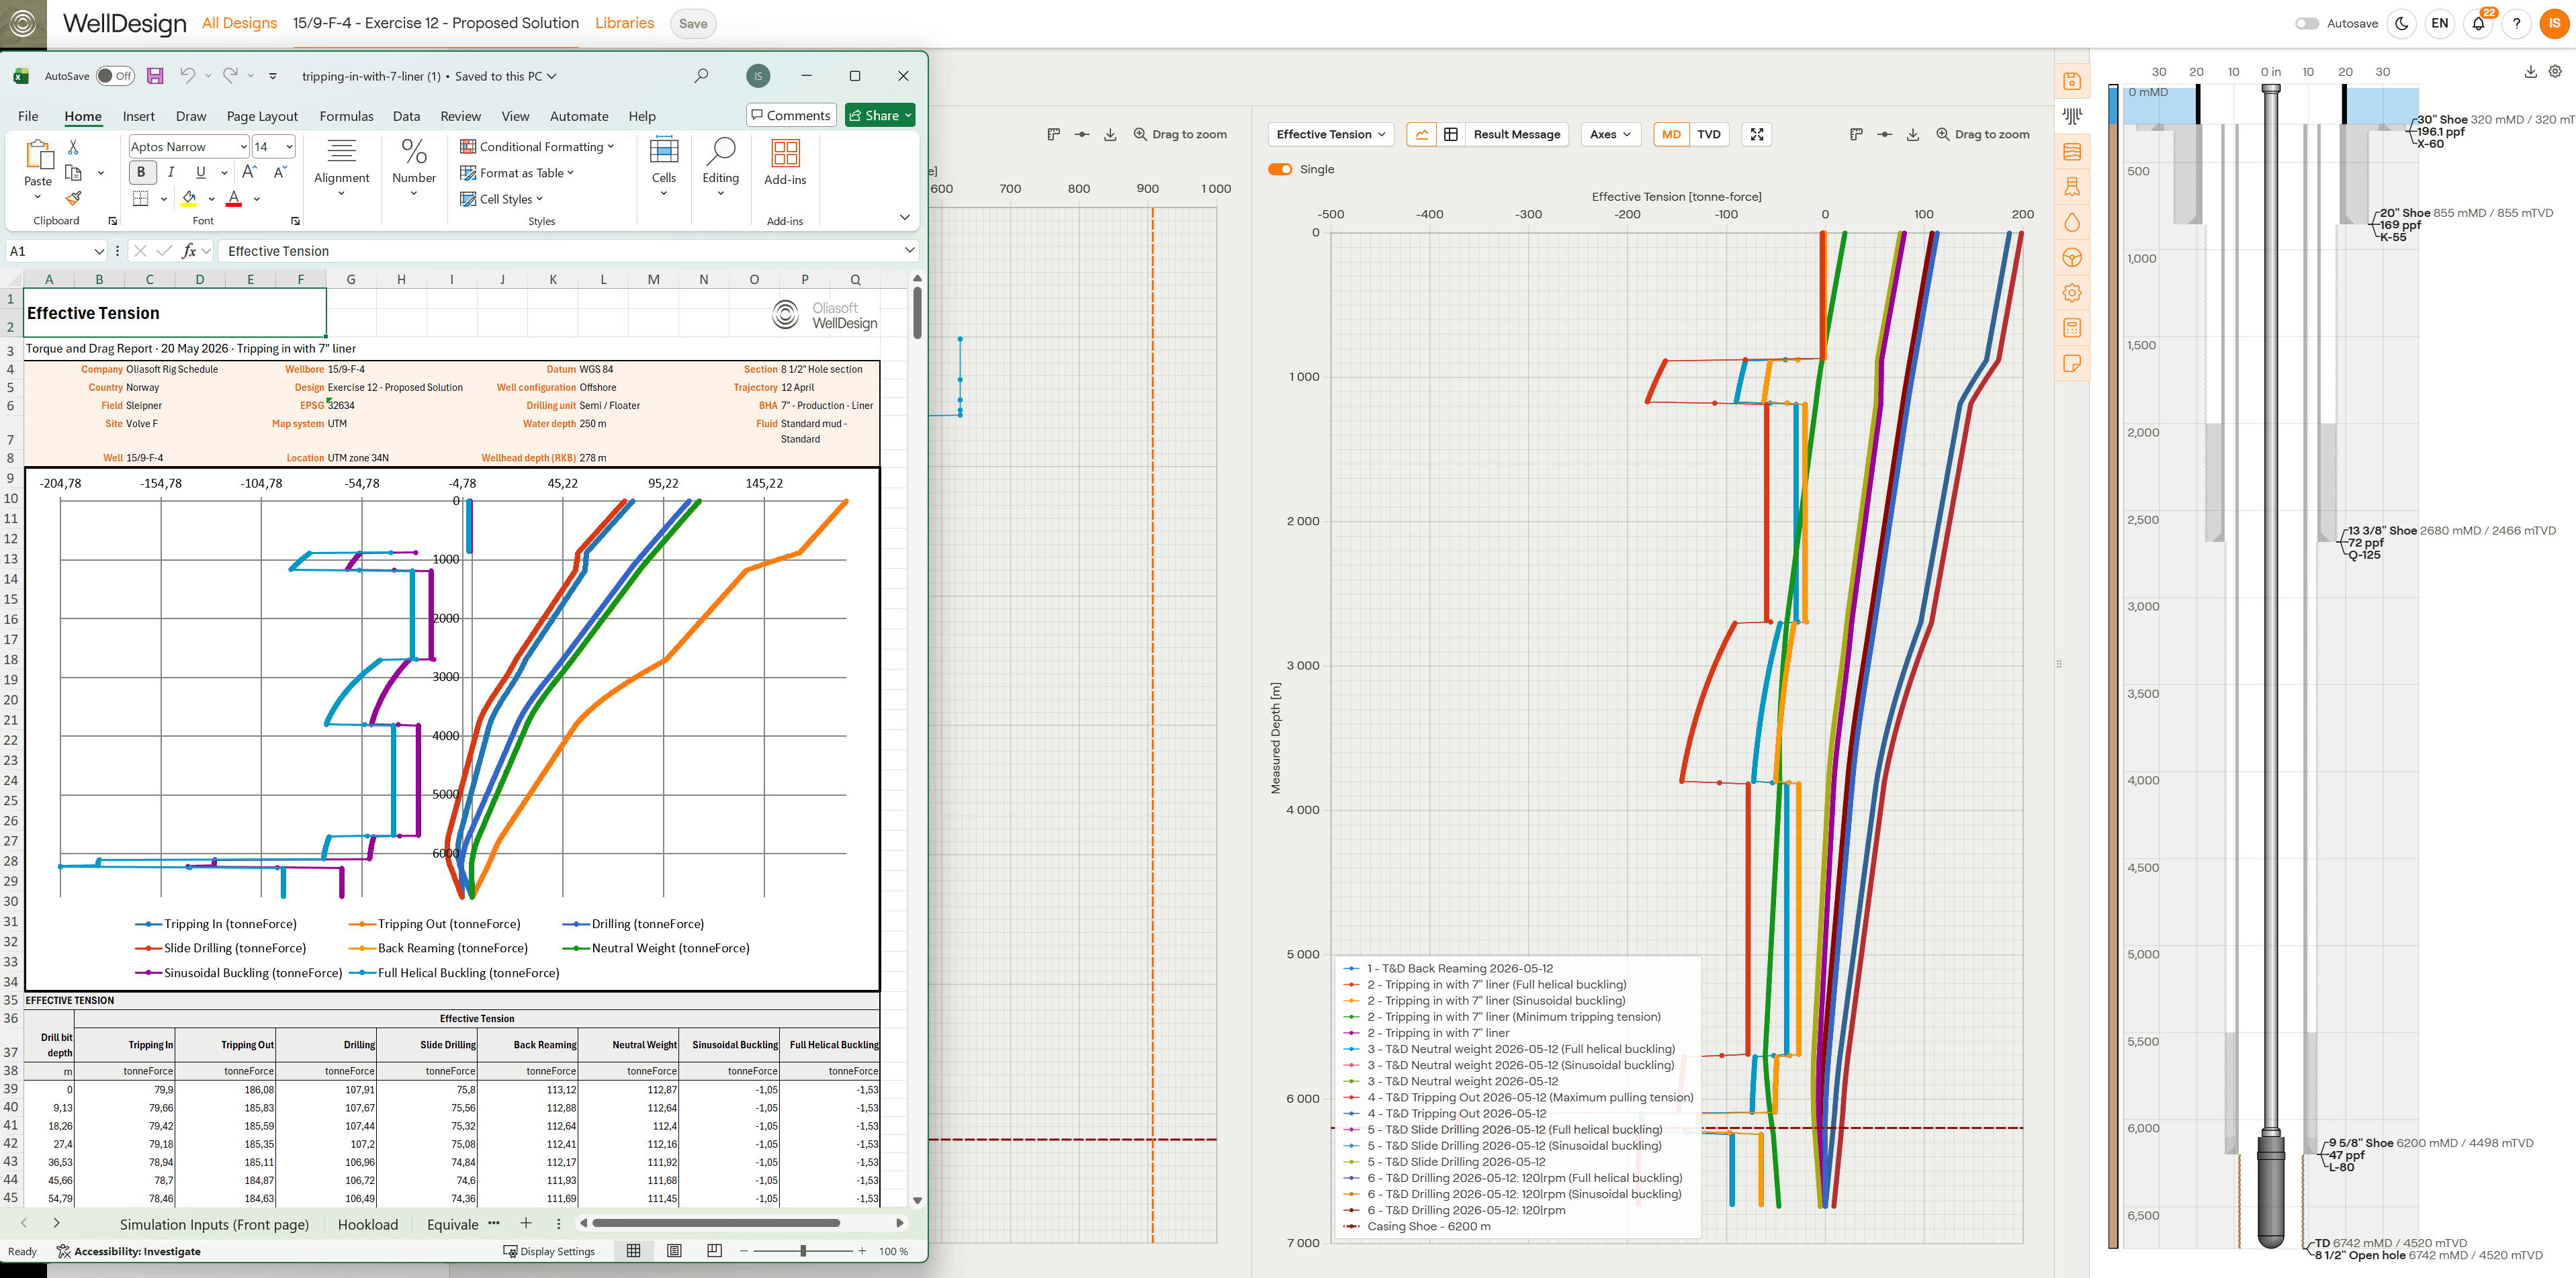
One of the toughest technical challenges was getting native Excel charts to render directly inside exported workbooks. The engine builds fully editable chart objects within Excel itself. The data stays live, the formatting stays clean, and users keep working long after the export finishes.
On top of that, the engine handles:
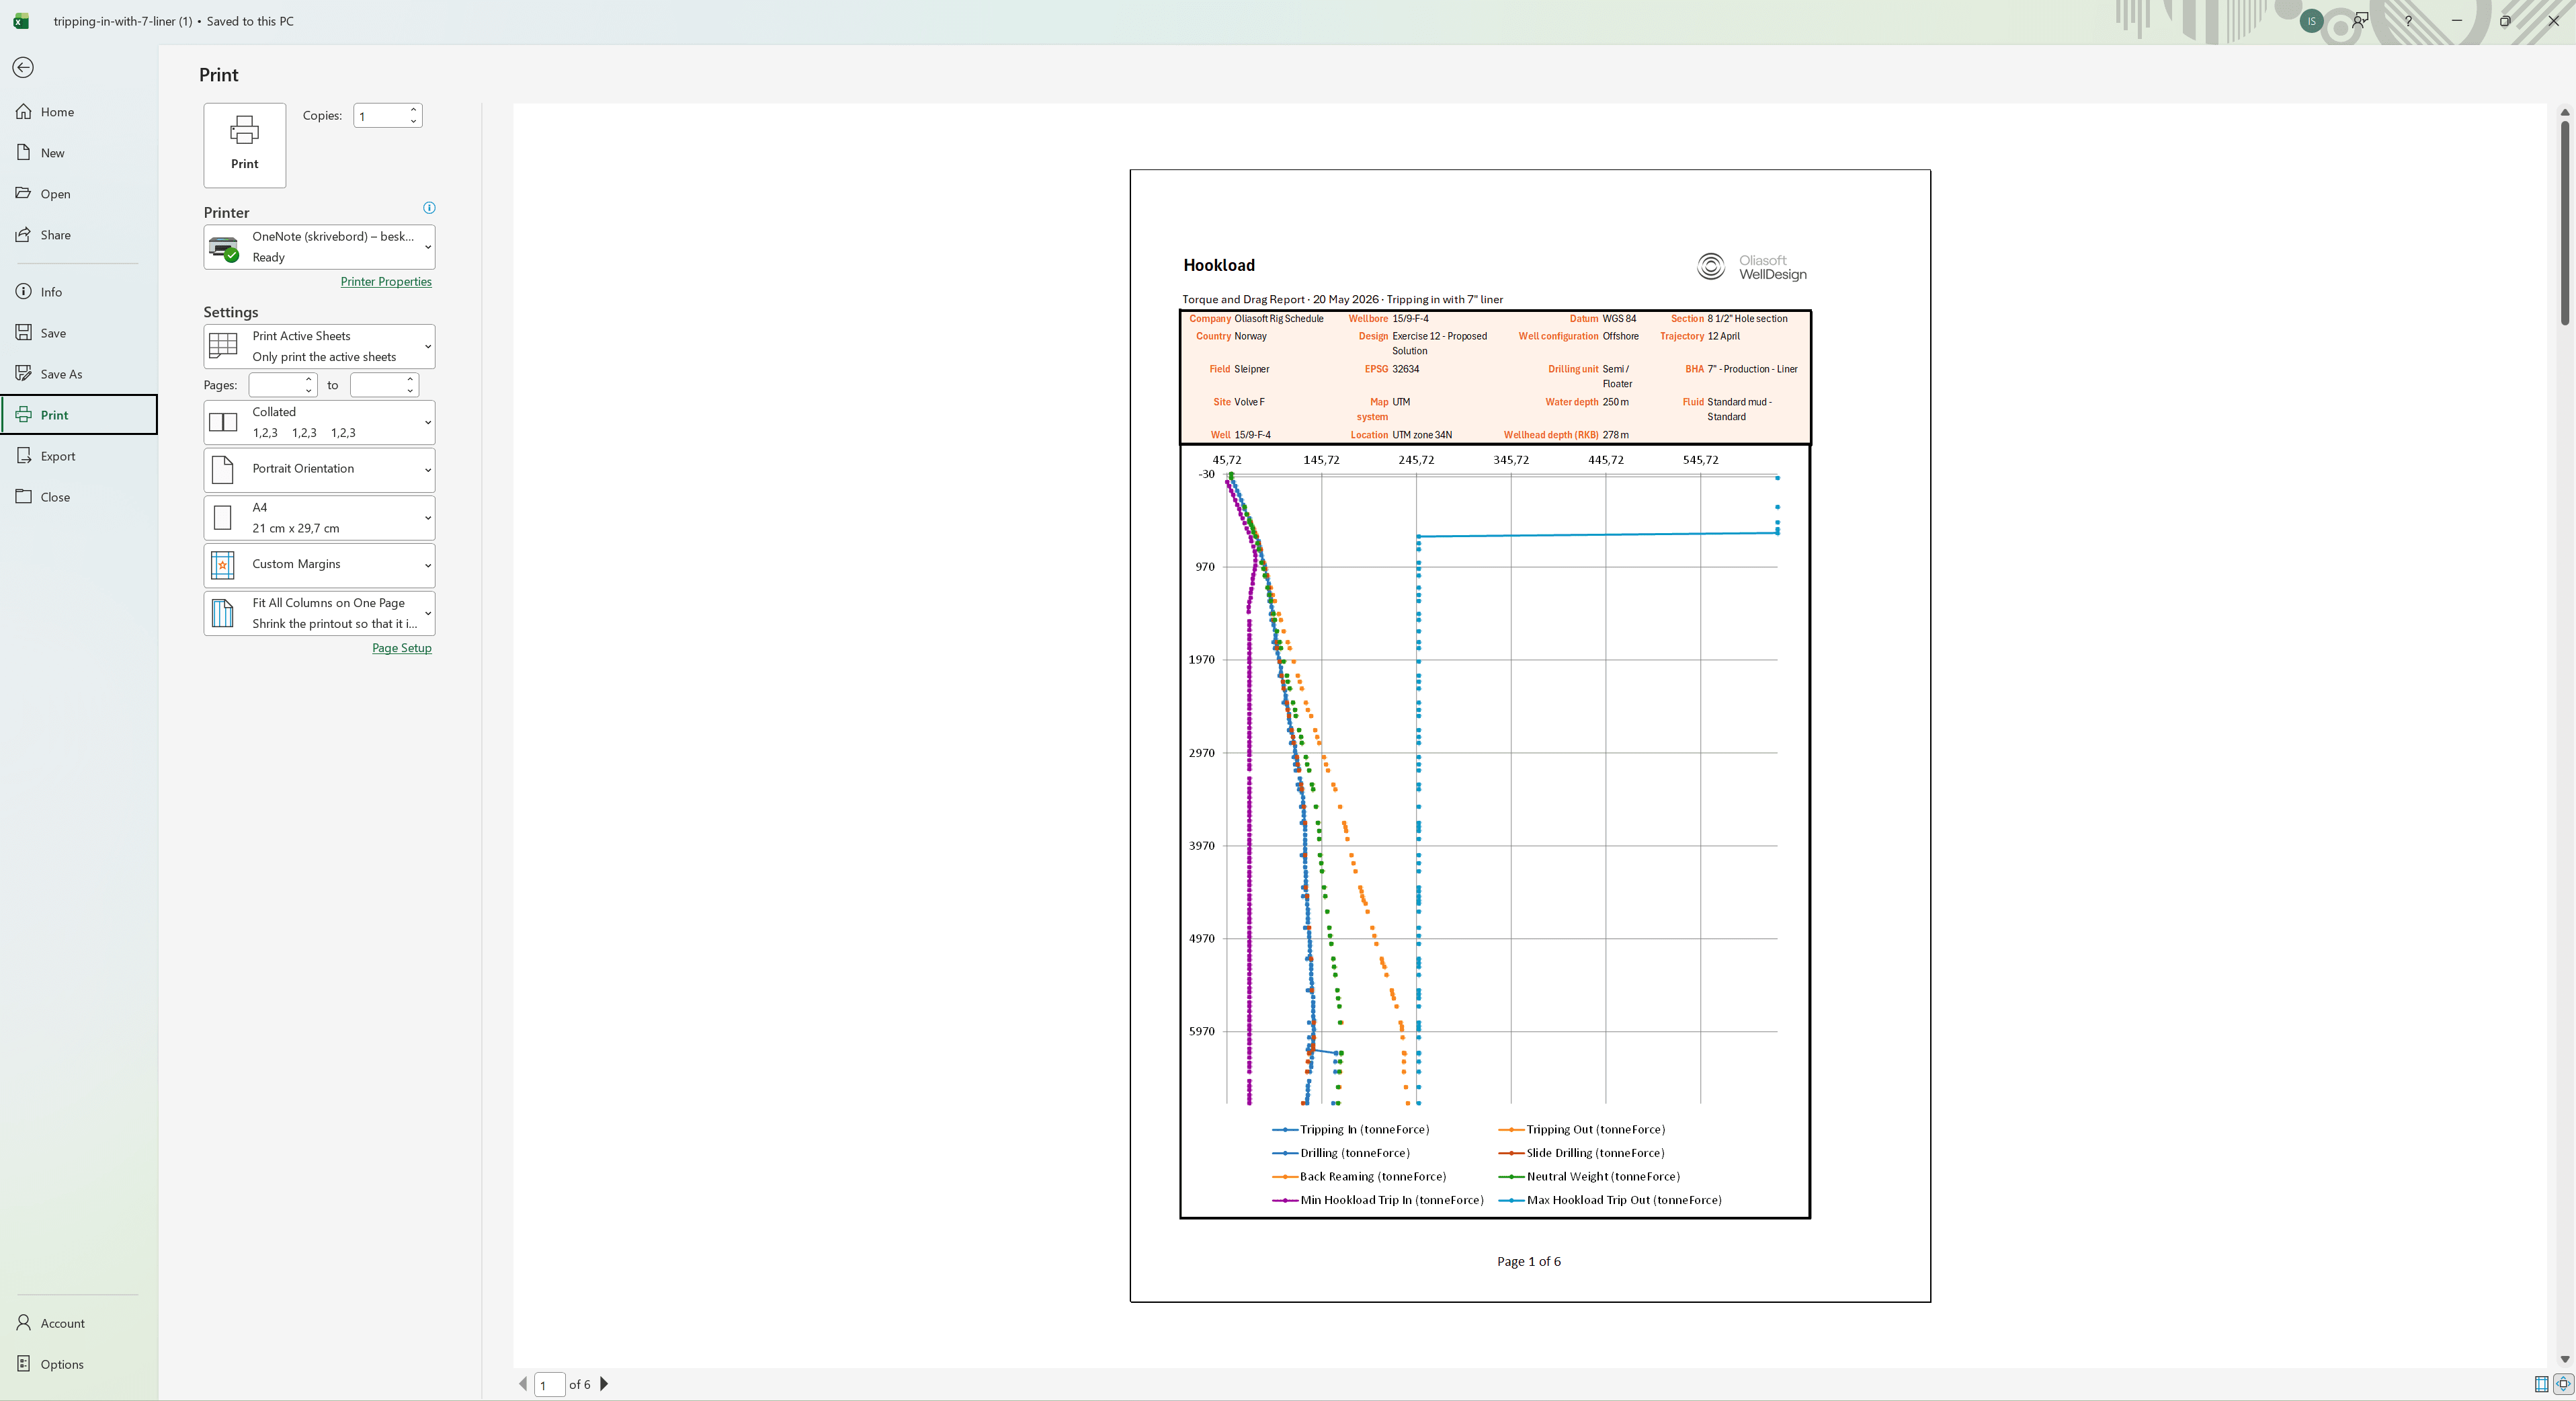
The result: reports that hold up on screen and on paper, ready for engineering documentation in any form.
Traceability sits at the heart of the reporting engine. Every report is a structured snapshot, generated directly from simulation results, capturing the exact state of the work at a single point in time.
That snapshot becomes a shared language across teams. Simulation inputs, engineering assumptions, calculated outputs, and supporting visualizations all sit in one consistent format, ready for review, audit, or handoff.
The payoff for users: cleaner audits, easier collaboration, and a faster path from simulation results to decision-ready engineering reports.
June 30, 2026
June 9, 2026
May 20, 2026